 company
The United States defense and military weapons manufacturers are publicly traded companies. Consequently, when global tensions escalate securities in this sector become more volatile and followed. Several defense stocks have seen an uptick in value due to current Middle East tensions.
Investing in this sector offers various avenues, with one of the most popular being the iShares US Aerospace & Defense ETF. This ETF is a composite index of U.S. equities within the industry and includes prominent companies such as Raytheon, Lockheed Martin, and Northrop Grumman. In essence, this ETF serves as a barometer for gauging the health and direction of the entire defense sector.
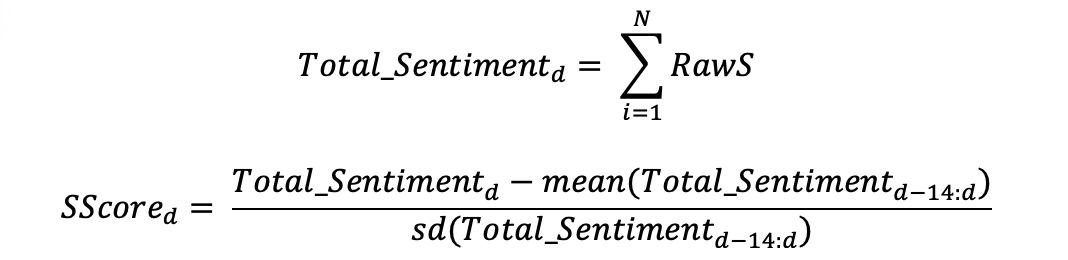
The objective of this research is to assess StockTwits sentiment for insights into the overall Defense sector. To achieve this, we collected raw sentiment data for all securities we carry in the Aerospace and Defense sector and standardized it over the preceding two weeks. The calculation is as follows, where N represents the number of companies in the industry that day, while d represents the date:
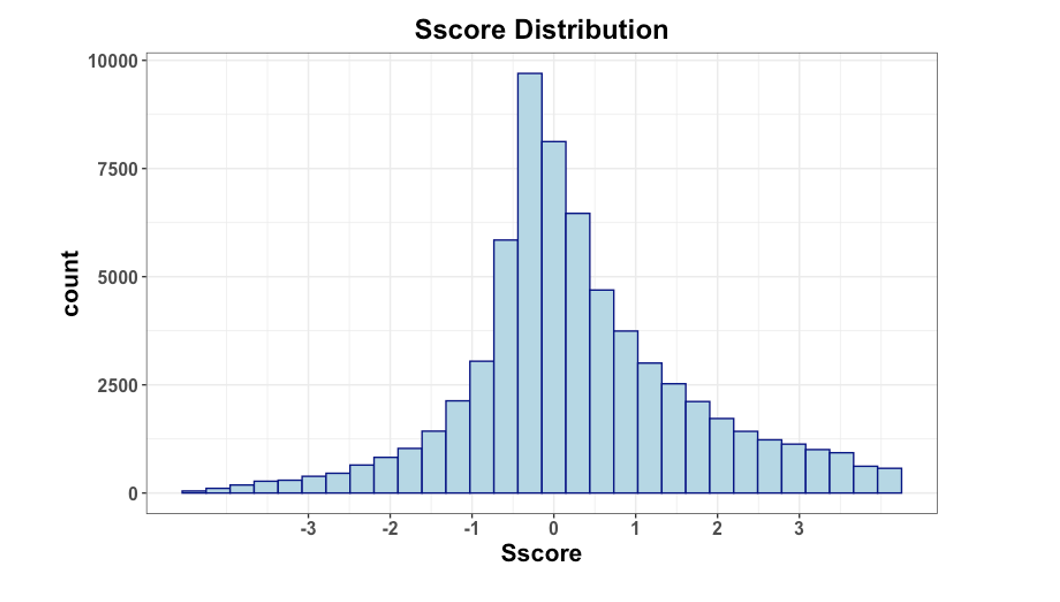
The distribution of the calculated 'SScore' is depicted below. While it displays a slight negative skew, it roughly resembles a normal distribution. Positive scores indicate greater positivity on StockTwits in the past 24 hours relative to the previous two weeks, while negative scores suggest more negativity.
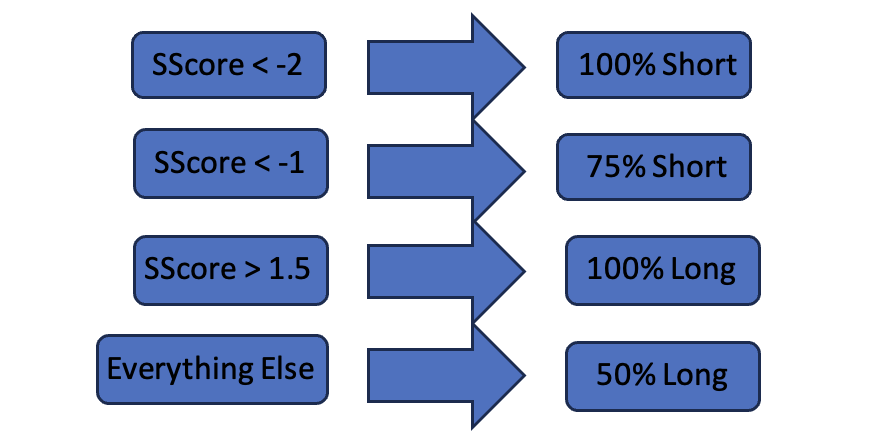
Using this SScore, we have established flags for our positions in the ITA ETF. We anticipate that when the SScore is more negative, the fund is more likely to decline; conversely, it should rise when the SScore is positive. These positions are determined daily, 20 minutes before the market's closing. The decision tree for the position taken is presented below.
We tested this strategy beginning in October 2018 to evaluate its performance over a 5-year period. Returns were calculated daily, using prices from market close to the next day’s market close.

Our analysis indicates that the sentiment flags have significantly improved the performance of the ITA ETF. The annual return has increased by more than 2.5%, and the cumulative return is over 30% higher. Simultaneously, it has reduced volatility and risk. From this, we can deduce that the aggregate StockTwits sentiment data from Context Analytics for the Aerospace & Defense sector is predictive of ITA returns. This is intriguing because the securities held by ITA do not exactly match those in the Context Analytics portfolio, but it still proves to be a useful market indicator.
This serves as yet another example of how sentiment data can be harnessed to leverage the stock market in unique and valuable ways. If you require further information on StockTwits data or any of our data packages, please visit our website at www.contextanalytics-ai.com or click the button below!